


Transportation Secretary Pete Buttigieg was caught on video unloading a bicycle from a gas-guzzling SUV before using it to ride a short distance to the White House for Thursday’s cabinet meeting.
The Post Milennial reports:
A person off camera can even be heard questioning why the Biden administration official would be wearing a suit while bike riding. Buttigieg has been at the forefront of advocating for President Joe Biden to implement new taxes on transportation, including taxing individual’s based on the amount of distance they have driven as well as increasing taxes on gas.
Pete Buttigieg's dog and pony show.
Use an armored Suburban to bring a bike within a short distance of the destination. Unload it and ride in with a security detail in tow, pretending to save energy. ???? pic.twitter.com/Pxynakrl59
— Tim Xeriland (@Xeriland) April 1, 2021
Last week, Buttigieg floated a possible mileage tax as a way to fund President Biden’s disastrous “infrastructure” bill, telling CNBC the tax “shows a lot of promise if we believe in that so-called user-pays principle: The idea that part of how we pay for roads is you pay based on how much you drive.”
During his Senate confirmation hearing, Buttigieg said “all options need to be on the table,” when asked about the gas tax.
“As you know,” he said, “the gas tax has not been increased since 1993 and it has never been pegged to inflation. That’s one of the reasons why the current state of the highway trust fund is that there’s more going out than coming in.”
For the full story, click HERE.

Media Says No Proof Of Election Fraud, Well Here's 3 States Worth of Proof
Whether it’s the mainstream media, Twitter, Facebook or any other platform with a leftist agenda, all you hear is that there is “no evidence” of election fraud.
Well, the Data Integrity Group (DIG) has showcased a mountain of evidence across several states and has so far released videos with their findings on Arizona, Georgia and Pennsylvania.
The goal of the group is to present irrefutable data. Sources for the raw data they used come from the Edison, Secretary of State, and SCYTL feeds which is what was used to certify the election totals.
Below is hard evidence from the data for those in the media and Democrats who continue to say there is no proof of fraud.
Pennsylvania
In this first slide the data scientists show negative votes across 15 counties in PA that total over 400,000 votes taken from President Trump. There is no question of whether or not this happened, this is the data used to verify the state–once again Edison, SOS and SCYTL data.

In the next two PA slides you can see in Allegheny County that absentee votes went up on a normal gradual scale for Joe Biden.
In Trumps slide you can see at the second time stamp there was an injection of 145,241 votes and then they are all taken away.


Trump’s Election Day votes in Allegheny were taken away as well at five different time intervals throughout the night, totaling over 25,000 votes which is confirmed across multiple data sources.

Here is Chester County PA where President Trump saw major decreases in votes across absentee and Election Day votes:

Lehigh County PA saw an over 66,000 vote drop for Trump:

Philadelphia has a history of corruption and this election looks no different. In this slide you can see the data shows Biden received a 47:1 vote ratio over Trump. Trump received 2,152 votes to Biden’s 100,236. In 278 precincts in Philadelphia it would mean 97 out of 100 people voted for Joe Biden. Some precincts showed 99% for Biden.

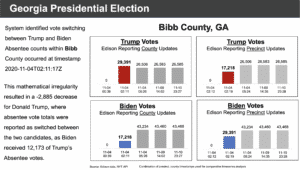
Georgia
In Bibb County, GA you can see there was an exact vote switch between Trump and Biden of 12,173, giving Biden the lead.
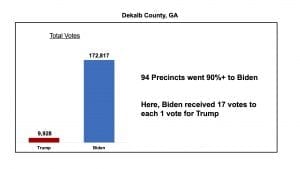
When we asked local residents about these numbers in DeKalb they said it’s impossible that 9 out of 10 people voted for Biden in their county.
Fulton County seems to have as much corruption as Philadelphia. But strictly looking at the data, 170 out of 384 precincts in Fulton County voted 90% or more for Joe Biden.
Trump received only 9% of Election Day votes and 4% of absentee in Fulton. There were several counties that reported 100% for Biden. These numbers represent statistical anomalies that do not exist in normal behavioral patterns.

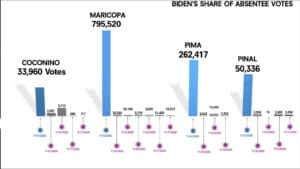
Arizona
As you can see all the gray bars are relatively even, which is what you would encounter with normal vote distribution. Statistically speaking, the blue bars, which all represent the first batch of absentee votes for Biden, should be roughly in line with the grey bars. Instead the massive difference in votes between the first batch and the rest implies a potential front load of votes for Biden in order to secure his win in the state.
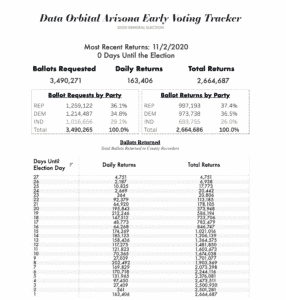
Questions and rebuttals arose that these spikes in the first drop came because more people early voted for Biden, but our second slide shows that there was an even amount of requests by Republicans for early vote ballots and an even amount of returns by Republicans which throws that argument out. Also these large early vote drops were not consistent across the state.
In order to make those numbers work Biden would have to have received 100% of the Democrats, 100% of the Independents and a large portion of the Republicans.
Sources confirm that 95% of registered republicans voted for Trump.
There is a large group of data scientist that are working on this data around the clock to showcase all the irregularities within the election.
Information on more states is still to come, including data on down ticket races.
What Crisis? Report Claims TX Migrant Facility Hits 729% Capacity, Kids Going Hungry
While the Biden Administration refuses to acknowledge its own manufactured crisis at the U.S. border, reports are now circulating that severe overcrowding has led to children going hungry and sleeping on floors—and in one instance—a facility has reached 729 percent of its legal capacity.
According to the Daily Mail, similar situations are faced by more than 3500 unaccompanied minors, some of them young children, being held in detention centers in border regions all across the state.
The government’s 72-hour maximum time for a child to be detained also seems to be far from reality in these facilities, as children are spending an average of 108 hours in these places. Some reports indicate that some children have had to spend as many as 10 days or more in these facilities due to immense delays.
“This situation mandates immediate action to protect the life and safety of federal personnel and the aliens in custody,” wrote Michael Meade, the acting assistant director for ICE’s field operations, adding that the crisis is likely to “grow over the coming months.”
According to a recent CBS report, one CBP facility in Donna, Texas was holding more than 1,800 people, which is 729% of its capacity.
“Most of the minors said they had only showered once while in U.S. custody, even though they’d been held for more than five days, according to Desai. Some said they had showered twice,” reported CBS.
For the full report, click HERE.