


In what may come as a shock poll to Democrats, Rasmussen Reports latest poll shows that a whopping 75 percent of Americans support voter ID laws—including 60 percent of Democrats!
Only 21 percent oppose the laws, which would require voters to show photo identification prior to casting their ballots.
Democrats are currently pursuing federal legislation to override state voter ID laws. H.R. 1, the so-called “For the People Act,” has already passed the Democrat-controlled House and will soon be introduced in the Senate.
Many Democrats are calling for the filibuster to eliminated or reformed so that H.R. 1 can pass by a simple majority vote, ending voter ID.
According to Rasmussen, 89 percent of Republicans, 60 percent of Democrats and 77 percent of those who aren’t affiliated with either party support voter ID laws.
Overall, 31 percent of respondents said that voter ID laws were discriminatory, while 60 percent said the laws were not.
If Democrats get their way with H.R.1, it would eliminate state voter ID laws.
Breitbart points out, “H.R. 1 says states ‘may not require an individual to provide any form of identification as a condition of obtaining an absentee ballot’ and lets voters to use a ‘sworn written statement’ rather than photo ID, which it calls a restriction on the right to vote.”

Media Says No Proof Of Election Fraud, Well Here's 3 States Worth of Proof
Whether it’s the mainstream media, Twitter, Facebook or any other platform with a leftist agenda, all you hear is that there is “no evidence” of election fraud.
Well, the Data Integrity Group (DIG) has showcased a mountain of evidence across several states and has so far released videos with their findings on Arizona, Georgia and Pennsylvania.
The goal of the group is to present irrefutable data. Sources for the raw data they used come from the Edison, Secretary of State, and SCYTL feeds which is what was used to certify the election totals.
Below is hard evidence from the data for those in the media and Democrats who continue to say there is no proof of fraud.
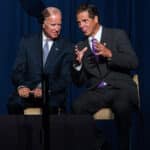
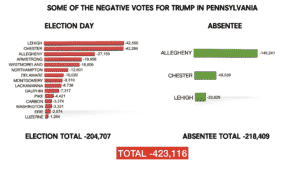
Pennsylvania
In this first slide the data scientists show negative votes across 15 counties in PA that total over 400,000 votes taken from President Trump. There is no question of whether or not this happened, this is the data used to verify the state–once again Edison, SOS and SCYTL data.
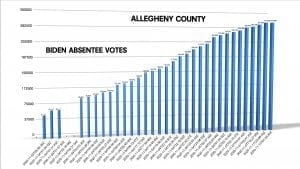
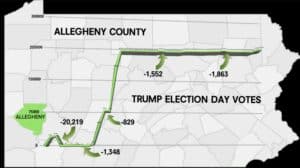
In the next two PA slides you can see in Allegheny County that absentee votes went up on a normal gradual scale for Joe Biden.
In Trumps slide you can see at the second time stamp there was an injection of 145,241 votes and then they are all taken away.
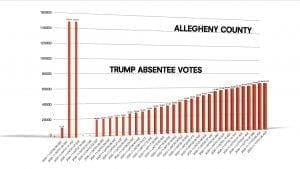
Trump’s Election Day votes in Allegheny were taken away as well at five different time intervals throughout the night, totaling over 25,000 votes which is confirmed across multiple data sources.
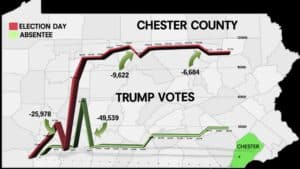
Here is Chester County PA where President Trump saw major decreases in votes across absentee and Election Day votes:
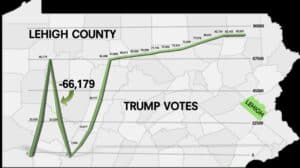
Lehigh County PA saw an over 66,000 vote drop for Trump:
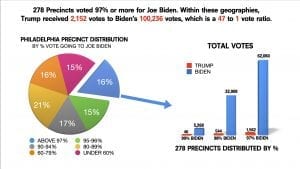
Philadelphia has a history of corruption and this election looks no different. In this slide you can see the data shows Biden received a 47:1 vote ratio over Trump. Trump received 2,152 votes to Biden’s 100,236. In 278 precincts in Philadelphia it would mean 97 out of 100 people voted for Joe Biden. Some precincts showed 99% for Biden.
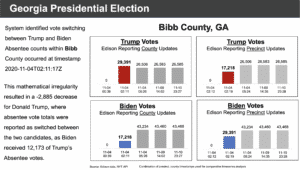
Georgia
In Bibb County, GA you can see there was an exact vote switch between Trump and Biden of 12,173, giving Biden the lead.
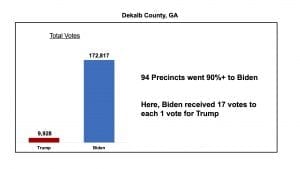
When we asked local residents about these numbers in DeKalb they said it’s impossible that 9 out of 10 people voted for Biden in their county.
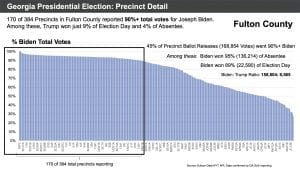
Fulton County seems to have as much corruption as Philadelphia. But strictly looking at the data, 170 out of 384 precincts in Fulton County voted 90% or more for Joe Biden.
Trump received only 9% of Election Day votes and 4% of absentee in Fulton. There were several counties that reported 100% for Biden. These numbers represent statistical anomalies that do not exist in normal behavioral patterns.
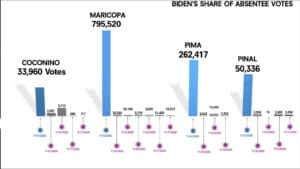
Arizona
As you can see all the gray bars are relatively even, which is what you would encounter with normal vote distribution. Statistically speaking, the blue bars, which all represent the first batch of absentee votes for Biden, should be roughly in line with the grey bars. Instead the massive difference in votes between the first batch and the rest implies a potential front load of votes for Biden in order to secure his win in the state.
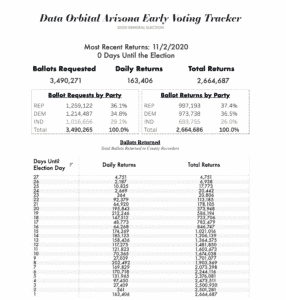
Questions and rebuttals arose that these spikes in the first drop came because more people early voted for Biden, but our second slide shows that there was an even amount of requests by Republicans for early vote ballots and an even amount of returns by Republicans which throws that argument out. Also these large early vote drops were not consistent across the state.
In order to make those numbers work Biden would have to have received 100% of the Democrats, 100% of the Independents and a large portion of the Republicans.
Sources confirm that 95% of registered republicans voted for Trump.
There is a large group of data scientist that are working on this data around the clock to showcase all the irregularities within the election.
Information on more states is still to come, including data on down ticket races.